Thesis – Analysis – Scenario 2

The second scenario in my analysis section looks at power supplied by 140MW of wind (purple), 50MW of solar (yellow), 50MW of ocean–wave (blue), and 64.3MW of biomass (green). This scenario leaves out the fossil fuel (brown) and the transmission (red). A one week run of the model in the summer from Sunday July 1, 2008 through Saturday July 7, 2008 is shown below.
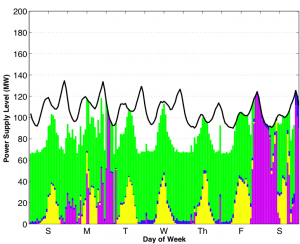
July 1, 2008 through July 7, 2008 power supplied where purple is wind, solar is yellow, ocean-wave is blue, and biomass is green. The black curve at the top is power demand.
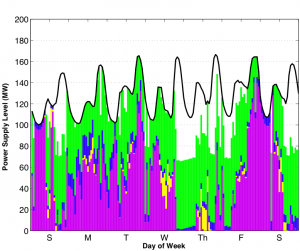
December 14, 2008 through December 20, 2008 power supplied. The high winds really help in the winter.

As you can see, without more biomass or another way of compensating for the intermittency of wind, solar, and ocean-wave power, a purely renewable portfolio for Humboldt County would not be adequate.

Please ask me questions if you like. I’d be happy to answer them.


Leave a Reply

Your email address will not be published. Required fields are marked *

This site uses Akismet to reduce spam. Learn how your comment data is processed.