Thesis – Analysis – Scenario 1
I have split the analysis section of my thesis into three scenarios. The goal of the first scenario is to demonstrate how the current power system meets electricity demand in Humboldt County.
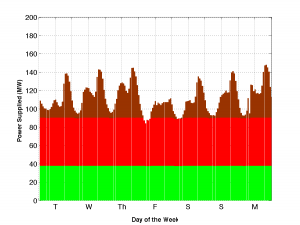
I ran the model for 7 days (168 hours). The plot above shows power supplied where green was supplied by biomass plants, red by transmission lines (imported power), and brown by fossil fuel powered plants (Humboldt Bay Power Plant).
The maximum output of the biomass plants combined with maximum imported power over the transmission lines cannot meet peak demand. This depicts the way the Humboldt Bay Power Plant, which is natural gas fired, must ramp up and down to meet the peak demand.
The biomass plants were run at 75% capacity with a maximum output of approximately 38MW. The transmission lines were run at 75% capacity with a maximum import of 52.5MW. So biomass + transmission = 90.5MW.

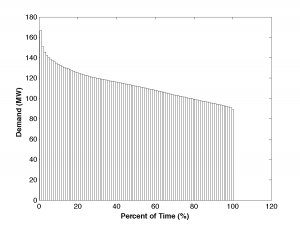
If we look up where 90.5MW falls on the above load duration curve, it looks like the Humboldt Bay Power Plant must be running close to 100% of the time which is good since turning the plant on and off is likely not feasible in a short period of time.
I am elated to see that my model accurately depicts the way I believe the current power system works in Humboldt County. I have left out power supplies that are less than 1MW of which there are several.
Rough draft of my write up of my thesis will be done very soon. Yipee!
