Thesis – Model Complete!
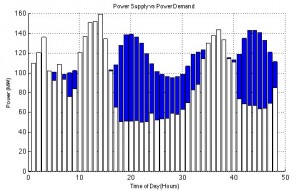
It’s been a feverish two weeks of work for me but it’s paid off. The model is complete. There are some minor adjustments to make so that the results look pretty and paper-ready but the main course is done. I have included a couple of images of the current scenario running. Keep in mind that this scenario is:
- Wind Farm on Bear River Ridge with maximum 70MW output
- A 25MW solar power plant in Southern Humboldt near Redway
- A 25MW solar power plant in Northern Humboldt near Blue Lake
- A 50MW wave farm off the coast.
- 32.5MW Humboldt Redwood Company plant at 75% capacity
- 18MW Fairhaven plant at 75% capacity
- 13.8MW Ultrapower plant at 75% capacity
It should be noted ahead of time that this scenario does not meet the power needs of Humboldt County. There are some times of night when the wind dies down and the sea is calm during which the biomass just does not meet the peak demand. See for yourself.

More data to come as I continue work on my presentation and write-up.
darrell,
very cool. two comments.
1. what is the sum of surplus power that can be exported during hours of over-capacity in humboldt?
2. can you re-size (increase) the solar and wind generation in your model so that the net surplus exported by humboldt matches the capacity gap between biomass generation and hours of excessive power demand? how about a second wind farm and a third solar facility?
this way you would have a theoretical net of zero rather than a negative as you have at present.
[wr]
darrell,
here’s another idea about increasing renewable generation capacity: site solar plants in s. humboldt near the main transmission line that comes north from mendocino county, and in e. humboldt by the main transmission line that comes west from the central valley. as these are the key incoming capacity constraints, turn them into maximum export facilities during peak sunshine hours. that is, export full capacity across the lines to the grid during daylight, then reverse the flow during non-daylight from the grid to cover local demand within the county. thus, build two sets of solar capacity, one for local demand, and one for export.
[wr]